We were on the small roads that sometimes turn gravel, sometimes dead end, when we found it. This was Vermont, about ten years ago, our first road trip together: a circuit of swimming holes, picnics, and stops for general store ice cream. We passed a series of “Take Back Vermont” signs. Somewhere along the way we came upon the man, who by all appearances seemed to be a Hare Krishna devotee, having a yard sale. It was here in the sunny warm greenness that we found THE PEOPLE’S CYCLOPEDIA OF UNIVERSAL KNOWLEDGE, WITH NUMEROUS APPENDIXES INVALUABLE FOR REFERENCE IN ALL DEPARTMENTS OF INDUSTRIAL LIFE. BROUGHT DOWN TO THE YEAR 1885.
I’m sure we came away with other trash and treasures, but it’s the provenance of theCYCLOPEDIA that I recall most vividly: a three-volume set, spines disintegrating, pages falling out mid-turn. Its contents were equal parts overwhelming, fascinating, appalling, and awe-inspiring, as only relics from the past can be.
A few months later we moved into our first apartment, applied several coats of paint, and began the process of making home. In one phase of an evolving decorating scheme, several pages from the CYCLOPEDIA found their way onto our walls: a series demonstrating the subtle differences among various leafy plants, the illustrated explication of just how a lever works, and this two-page spread:
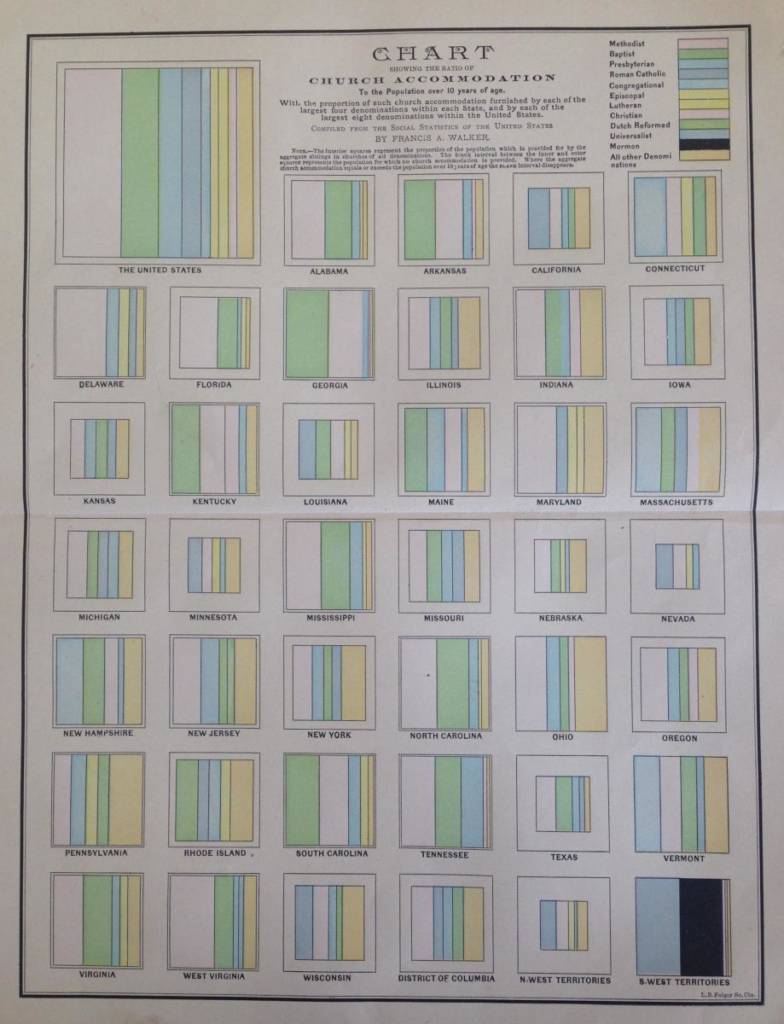
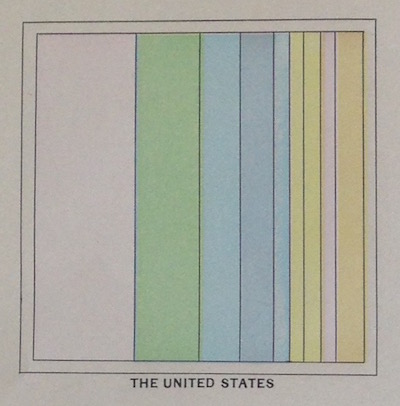
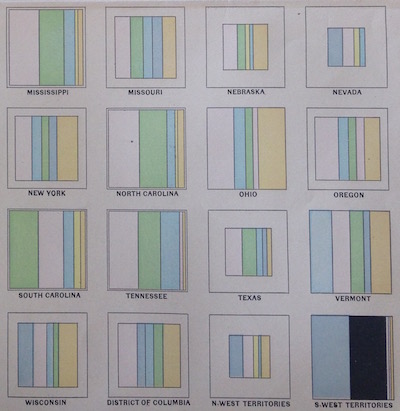
THIS CHART SHOWING THE RATIO OF CHURCH ACCOMODATION TO THE POPULATION OVER 10 YEARS OF AGE is a geometric snapshot of history compiled under the direction of Francis A. Walker, superintendent of the 1880 census. The data charts the distribution of the largest denominations of Christianity (and ALL OTHER DENOMINATIONS) in the United States in the late-19th century: 37 states plus the District of Columbia and the North- and Southwest Territories. Accommodation may be defined as that which is suitable or sufficient to hold or contain something; in this case, one’s religious conviction or assignation: Baptist, Presbyterian, Methodist, Lutheran, etc. Each color-coded bar represents its corresponding proportion of the population. All the states together are supposed to add up to that collective sense of universal knowledge, or to the sense that such a thing exists, that it is within reach.
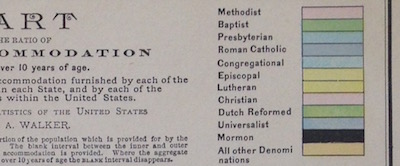
On the page, variations in geographic area and population size give way to ratio’s great equalizing power; it’s not how big or how many, but what portion. The strategic drawing of state lines are discarded in favor of the precision and pleasing uniformity of the square. This historical and selective mapping reframes the nation in boxes and pastels (but for the harsh black bar of Mormonism, which I can only read as reflecting, at best, a deep national anxiety, at worst, outright animosity).
Falling more in the ‘Blank Interval’—without religious accommodation—I’d be hard-pressed to delineate the differences between most of these denominations (let alone distinguish between the colors of a palette long faded by time), but I can stare at this page for a good long while. The repeating, fluctuating blocks of muted hues, their insistent flatness, is captivating. The data set—dry, but complicated—so seemingly at odds with the simple beauty of its representation. Despite its age, the composition calls to mind an aesthetic that feels essentially modern, if not contemporary.
But the chart’s visual appeal cannot be entirely divorced from the data it reflects, the origins and intentions of the document’s creation. In this demarcation, who is counting, who is (and is not) being counted, and in what context? There is, in the process of tracking and enumeration, a suggestion of ‘keeping tabs,’ and the question, to what end? And so, alongside the document’s striking appearance is a somewhat amorphous discomfort. Certainly, statistics and data are not without value or function; on the contrary, methodical study seeks to inform action on the basis of facts—to act not from feeling but knowing, to broad benefit. But, for all the plentiful utility such tabulation can provide, numbers do not exist in a vacuum. Categorization also reflects valuation and a vantage point, and in that judgment is the potential for a sinister element—recall that black block of Mormonism in the Southwest Territories, the amorphous ‘other’ consigned to the edges in their blank intervals.
Today, a concern with the religiosity of the population of the United States is as present in the broad conversation as ever (if not more so). Such tracking and mapping continues, captured by the Census Bureau, the Association of Statisticians of American Religious Bodies, and other various nonprofit and journalistic endeavors. The results, their supposed repercussions, are discussed and debated ad nauseam in repeating news/election cycles. But in this chart here, now, 130 years out of date, is a visual simplicity and serenity that, from a certain angle, belies, denies even, its implications. It is a snapshot mapping a facet of a facet of the population, a state of the nation at a specific moment. It is one version of an ongoing attempt at ‘universal knowledge,’ beautiful in spite of itself.
Of the handful of pages pulled from the CYCLOPEDIA only this chart made the cut when we moved; it now adorns our stairwell, while the rest languish on a shelf, reinserted haphazardly into their original volumes, incrementally decomposing.
Elizabeth Witte received her MFA in poetry from the Bennington Writing Seminars and is the Associate Editor of The Common. She is the author of the chapbook Dry Eye (Dancing Girl Press, 2014).